Visualization
Here all helper functions for visualization are explained. Up till now only one custom plotting function exists, i.e.
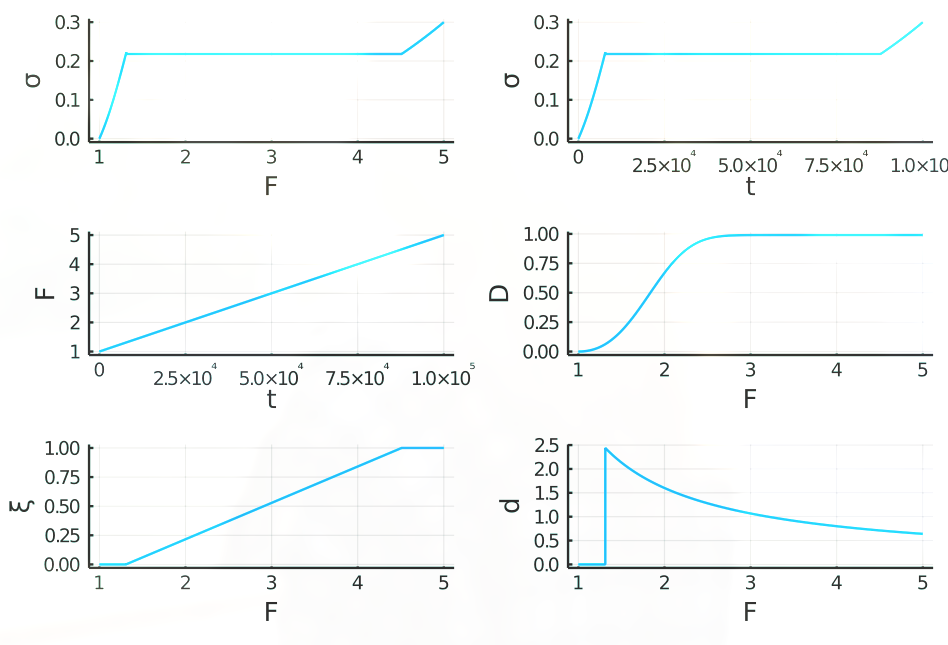
ConvexDamage.plot_all — Functionplot_all(damage_history)plot all information of a given damage_history array containing all history-dependent values of one gauss point. The aformentioned array is returned by the solve function as its third argument.
plot_all(fiberdamage_history::Array{FiberDamageState,1}, fiber=1)plots the same as in plot_all(damage_history), but only for one fiberdirection. Fiberdirection can be controlled via fiber::Int keyword argument
Should return something like: